| Historial trend of
the last 24 hours |
 Web
Web |
 Index
Index |
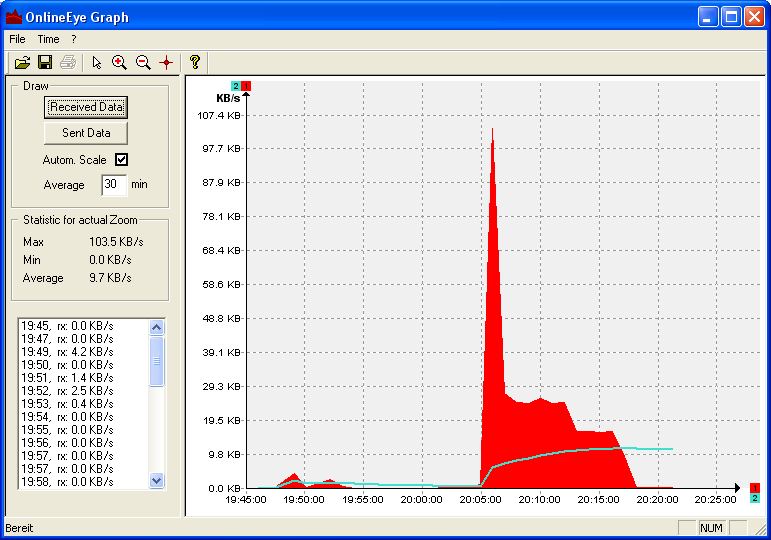
Your total Up/Downloadtransfer is recorded 24 hours and shown in graphic form.
That’s the ultimative Tool showing Bandwidth problems of your provider.
The
graphic can be stored, opened later as well as printed.
Analyse:
 Move the cursor to get all
information at a specific time
Move the cursor to get all
information at a specific time
 Zoom in
 Zoom out
Time Period:
In
the menu "Time" You can specify how many hours from now to the past
should be shown in the graph
Display:
Y-axis
= transferrate, is taken over from the OnlineEye properties. If you want to
select the resize the graph so that every value fits into the display area,
choose "Autom. Scale "!
The
average value is shown as a line and you are able to adjust the average time.
Redraw the graph to apply the changes you have made.