Here you can adjust the realtime graph upon your needs.
Bandwidth
- Auto Scale ... The graph resizes automaticlly so that all the traffic will
be displayed within the display area
- Free Scale ... Sets your bandwidth for up/download from 14.4 KByte to 100
MByte
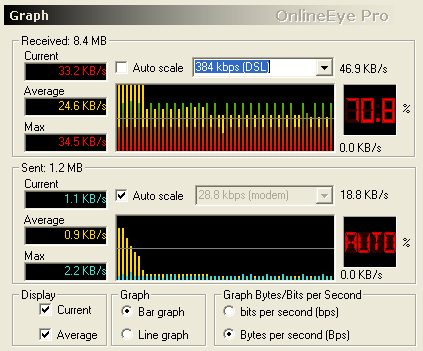
Each of the graphs provide an Auto Scale option which dynamically adjusts
the range of the graph so that all bars, or lines, are drawn completely within
the graph. Auto Scale is recommended if you are using a high bandwidth device
such as cable, DSL, or T1 line.
Modem users may wish to manually
configure the range of the graph to match the rated speed of their modem.
For example, if you have a 56 kbps modem, set the graph display mode to bps,
and adjust the slider control so that the topmost value in the graph displays
56k bits/sec.
Graph Display
Current
.............. The
current traffic is displayed.
Average value .... Average traffic is shown, you can adjust the Average time
here: "Settings".
Graph
Graphic display has two modes Bargraph or Linegraph.
Traffic
Scale
Scale and display of all data is either Bit/sec or Byte/sec, 1 Byte = 8 Bit.
The conversion to KB/sec or MB/sec is done automatically, 1MB = 1024KB, 1KB = 1024Byte
The current and average values reflect data
throughput rates using either bits per second or bytes per second. Throughput
is the amount of data that has been sent, or received, within a specific duration
of time. The greater the throughput, the faster your Internet connection is.
By
convention, data transmission devices, such as modems and networks, are measured
in bits per second, or bps. Data storage devices, such as hard drives and
memory, are measured in bytes and use a capital B as in Bytes per second,
or Bps. To avoid confusion, NetPerSec uses the entire word as in Bytes/sec
and bits/sec when displaying values.
When
viewing data transmission rates in bits per second (bps), you are comparing
the efficiency of your modem or network interface to the actual data throughput
of your Internet connection. For example, if you are using a 56 kbps modem,
and want to see how well it is performing, use the bits per second option
in OE. Displaying bits per second is also helpful when playing media over
the Internet such as streaming video. If your cable connection is currently
averaging about 150 kbps you'll know beforehand that selecting the high bandwidth
300 kbps movie will result in long pauses and dropped frames. You'll get better
results with the smaller 100 kbps version.
When
displaying bytes per second (Bps), you are measuring efficiency in terms of
data storage and the calculations are done using binary format. You will want
to use this option when downloading files from the Internet or moving files
across a network. The values displayed in OE will be consistent with those
reported by your browser, or FTP utility, when indicating the bytes received
per second.
Values
may also be combined with the standard metric prefixes: kilo, mega, and giga.
These prefixes are abbreviated using the single letters k,K,M and G.
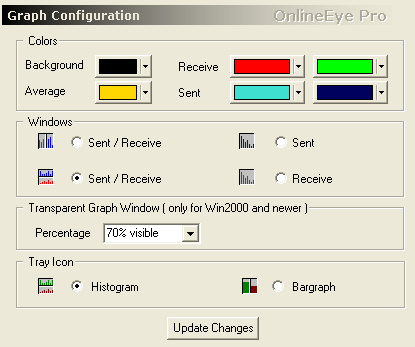
These
settings refer to both the small graphic window and the graph above.
Color
selection :
- background ....... apply to send/receive
-
average value .... apply to send/receive
These properties are activated by clicking
"Update Changes"
Window
Display :
You
can choose between 4 different display modes.
Transparent
graph window :
With
Win2000 or newer, the window can be shown transparent.